
The spreadsheet calculated. So why was the result suspicious?
An anonymised energy-indicator calculator case: from questioning a result, through variants and tests, to a deliberately limited change.
- Goal
- Find the cause of suspicious energy-calculator results and correct the agreed rules without changing the input data.
- Tools
Google Sheets · AI agent for analysis and variants · second AI agent for review
- Process
- Suspicious result → formula analysis → variants and comparison → my decision → two corrections implemented and read back after saving.
- Result
- Two of four proposed corrections implemented. The brief reports 22 tests and 255 cell changes transferred; two proposals were deferred. This is not a validation of the energy-use model.
Tools and division of work
- Google Sheets — the spreadsheet where the 22 tests reported in the brief were run for different floor areas and formula-join thresholds.
- AI agent — analysing dependencies and formulas, preparing variants and before-and-after comparisons.
- Second AI agent — an independent review of the proposed corrections. Its assessment does not replace that of a specialist in the energy model.
My role was to question the result, assess the proposals and select the scope of implementation. I accepted two of four corrections and left the other two for further work.
Process: I started with a suspicious result
In a complex spreadsheet, a suspicious result is a good starting point for an investigation, not proof that it needs to be “capped”. In this anonymised case, the spreadsheet estimated indicators for buildings: useful energy (EU), final energy (EK) and primary energy (EP). I noticed high results and formed a hypothesis that values should not exceed 350. That was a hypothesis to check — not a universal limit for those indicators.
Work with AI therefore began with a simpler question: which formula and which rule-selection logic produce the result? I asked it to read dependencies in the spreadsheet, prepare variants and check them at repeatable points. I assessed what made sense in this model and chose the scope of the change.
Check where a formula stops fitting
One lead was a polynomial fitted to a particular range of floor area. Outside the range from which it was derived, such a formula may behave differently from what we expect: for example, it may keep increasing or tend towards negative values. That is not yet evidence about energy use or a physical diagnosis of a building. It is a signal to check separately the area in which the formula is applied.
For large floor areas, a bounded continuation was therefore proposed, joining the existing curve at a specified threshold. We checked whether both sides have the same value and whether the curve has the same slope there. For smooth sections, agreement of the value and derivative gives a smooth C¹ join: no jump and no sudden kink in the line.
Correct the formula, not only its result
The analysis also covered rule selection. A mechanism that reduced a higher number of storeys to a substitute value was removed, building-type selection was organised by category, and a rule-match check was added. At small floor areas, cases where curves for neighbouring construction-year ranges crossed in a way inconsistent with the model’s assumed ordering were also checked.
I did not choose a simple cap on the result. The direction was different: correct the formula itself where it showed an inconsistency, then compare the effects before implementation. The important lesson is that a correction does not have to reduce every number. Its aim may be a more consistent rule curve.
Result: two approved corrections and a read-back check
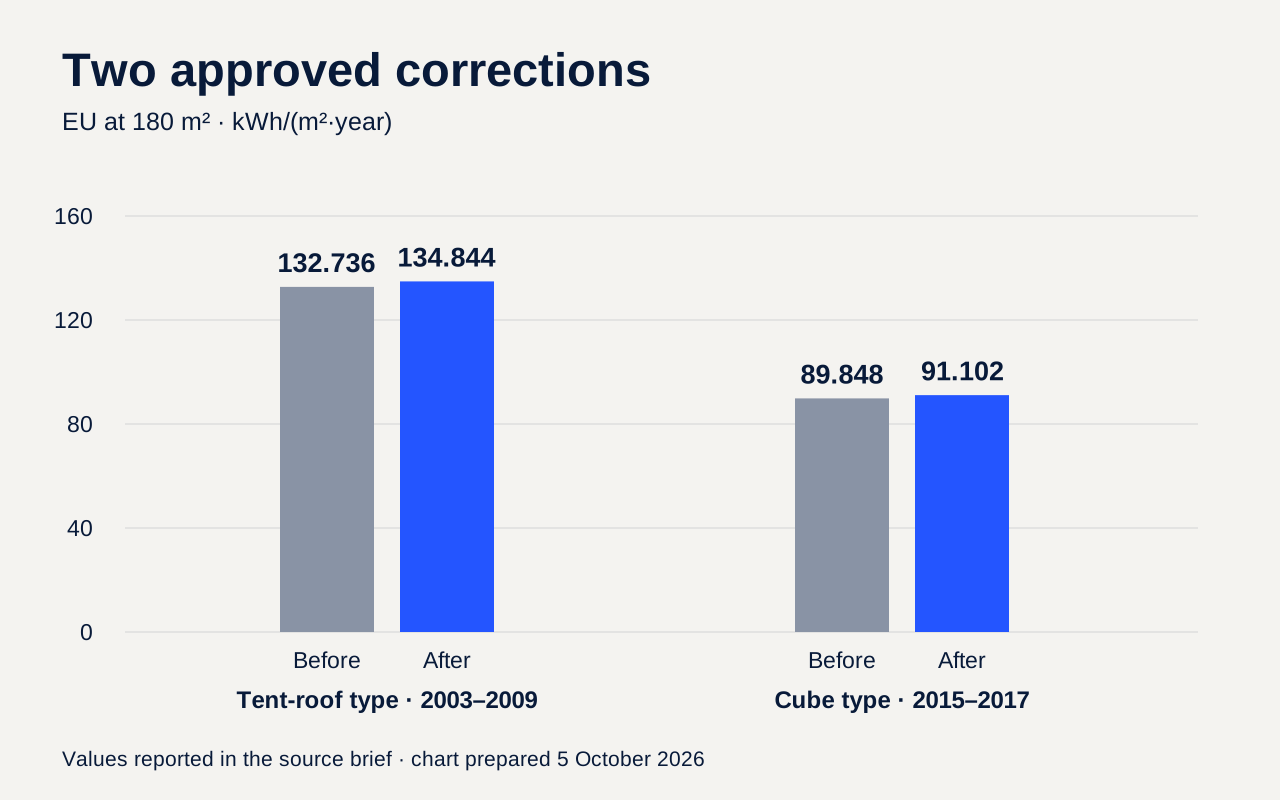
The table below is a visualisation of values provided in the source brief, not a spreadsheet screenshot or a new measurement. It applies to a floor area of 180 m².
| Corrected rule | EU before the change | EU after the change |
|---|---|---|
| Tent-roof type, 2003–2009 | 132.736 | 134.844 |
| Cube type, 2015–2017 | 89.848 | 91.102 |
Unit: kWh/(m²·year). Of four proposed corrections, I selected these two. Two variants concerning manor-house cases changed results more noticeably, so I deliberately did not implement them; known inconsistencies in that part remain unresolved.
Both implemented corrections passed 22 tests in Google Sheets across different floor areas and around the join thresholds. In a second file, I transferred 255 cell changes and confirmed their consistency after saving. I am citing results recorded in the summary of this work; this is not a new test carried out for this entry. The number 255 describes cell changes, not 255 errors.
Give AI a task that can be checked
Instead of asking it to “fix the spreadsheet”, state the task boundary and the evidence you expect:
Find the cause of the specified result and the cells responsible for it.
Check the formula for a small, typical and very large input value.
Before changing anything, show the before-and-after values and identify which rules you will change.
Keep the input data; change only the agreed logic.
After saving, read the specified cells again and compare the result.
This prompt makes a human decision easier: first a diagnosis and a variant, then approval for a specific correction, implementation, and a read-back after saving. In this case, a second AI agent carried out an independent review, but it does not replace a specialist assessment.
What this example confirms, and what it does not
Correct formula operation and mathematical consistency do not confirm that a model matches actual energy use. That requires reference data and a specialist assessment. Nor should an AI review be presented as that validation.
After the change, naming the approved version and locking the file against accidental edits were discussed. The file lock was not performed. Apply the same rhythm in your work: suspicious result → diagnosis → variant → comparison → human decision → implementation → verification → version label.